Compare time frames in reports
Details
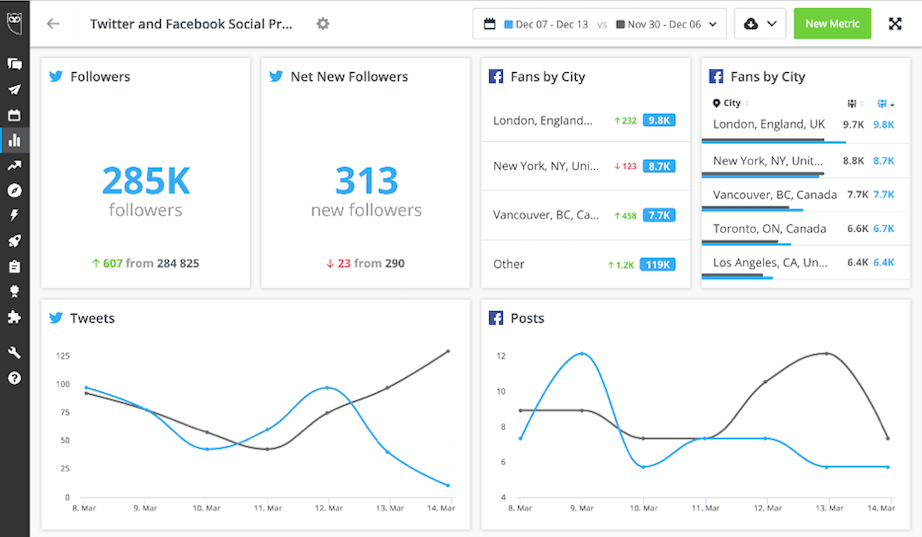
Analytics customers can now select two different time frames when editing report dates to compare performance across time periods. This lets customers measure campaign impact, identify trends, and visualize changes in performance year-over-year, month-over-month, or across a custom time frame.
To visualize data across two time frames, tiles must be configured to one of the following formats:
Line chart
Column chart
Number
List
Please complete the form to learn more
* indicates required fields
Related updates

Enhanced Advocacy Program metrics in Parliament
Enhanced Advocacy Program metrics in Parliament let you segment and filter advocate activity by team, geography, and sharing behavior, giving you deeper visibility into engagement across your organization.
@Mentions dropdown: Find and select X accounts as you type
@Mentions dropdown lets you search and select the right X account directly in Composer, so you can tag accurately without leaving Hootsuite.

LinkedIn First Comment
LinkedIn First Comment lets you draft, preview, and publish your first comment alongside your LinkedIn post, so you never have to leave Hootsuite to finish the job.

Unlock insights tailored to your business
Get your zero-risk trial to see how Hootsuite can power brand growth with the industry’s deepest insights.